Solar PV Analysis of Cincinnatus, United States
Cincinnatus, New York, located in the Northern Temperate Zone, presents a varied landscape for solar energy production throughout the year. This location experiences significant seasonal fluctuations in solar output, which directly impacts the efficiency of photovoltaic (PV) systems.
Seasonal Solar Performance
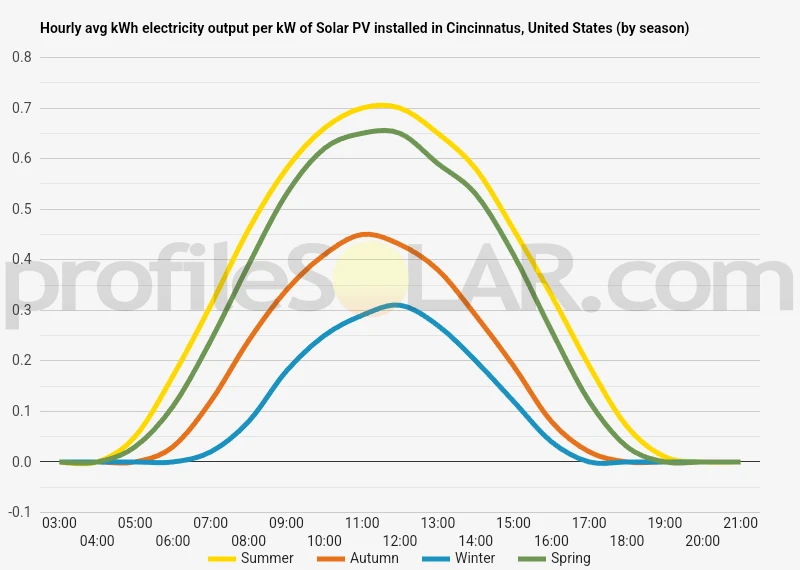
Summer stands out as the most productive season, with an impressive 5.92 kWh per day for each kilowatt of installed solar capacity. Spring follows closely behind, generating 5.16 kWh/day. These seasons offer ideal conditions for solar energy harvesting, with longer daylight hours and more direct sunlight.
Autumn sees a noticeable decrease in production, dropping to 3.00 kWh/day. Winter presents the greatest challenge, with output plummeting to just 1.78 kWh/day per installed kilowatt. This significant reduction is due to shorter days, lower sun angles, and potentially increased cloud cover.
Optimizing Solar Panel Installation
To maximize year-round solar energy production in Cincinnatus, fixed solar panels should be installed at a tilt angle of 36 degrees facing south. This orientation helps capture the most sunlight across all seasons, balancing the high summer sun with the lower winter sun angle.
Environmental Considerations
While Cincinnatus doesn't face extreme environmental challenges, there are factors that could impact solar production:
- Snow accumulation in winter can temporarily reduce panel efficiency
- Leaf fall in autumn may require more frequent panel cleaning
To mitigate these issues, consider installing panels at a steeper angle to encourage snow sliding off and implement a regular cleaning schedule, especially during autumn. Additionally, using snow-shedding coatings on panels can help maintain production during snowy periods.
Despite the seasonal variations, with proper installation and maintenance, Cincinnatus can still be a viable location for solar PV systems, particularly leveraging the high production periods of spring and summer to offset the lower winter output.
Note: The Northern Temperate Zone extends from 35° latitude North up to 66.5° latitude.
So far, we have conducted calculations to evaluate the solar photovoltaic (PV) potential in 4253 locations across the United States. This analysis provides insights into each city/location's potential for harnessing solar energy through PV installations.
Link: Solar PV potential in the United States by location
Solar output per kW of installed solar PV by season in Cincinnatus
Seasonal solar PV output for Latitude: 42.541, Longitude: -75.899 (Cincinnatus, United States), based on our analysis of 8760 hourly intervals of solar and meteorological data (one whole year) retrieved for that set of coordinates/location from NASA POWER (The Prediction of Worldwide Energy Resources) API:




Ideally tilt fixed solar panels 36° South in Cincinnatus, United States
To maximize your solar PV system's energy output in Cincinnatus, United States (Lat/Long 42.541, -75.899) throughout the year, you should tilt your panels at an angle of 36° South for fixed panel installations.
As the Earth revolves around the Sun each year, the maximum angle of elevation of the Sun varies by +/- 23.45 degrees from its equinox elevation angle for a particular latitude. Finding the exact optimal angle to maximise solar PV production throughout the year can be challenging, but with careful consideration of historical solar energy and meteorological data for a certain location, it can be done precisely.
We use our own calculation, which incorporates NASA solar and meteorological data for the exact Lat/Long coordinates, to determine the ideal tilt angle of a solar panel that will yield maximum annual solar output. We calculate the optimal angle for each day of the year, taking into account its contribution to the yearly total PV potential at that specific location.

Seasonally adjusted solar panel tilt angles for Cincinnatus, United States
If you can adjust the tilt angle of your solar PV panels, please refer to the seasonal tilt angles below for optimal solar energy production in Cincinnatus, United States. As mentioned earlier, for fixed-panel solar PV installations, it is optimal to maintain a 36° South tilt angle throughout the year.
| Overall Best Summer Angle | Overall Best Autumn Angle | Overall Best Winter Angle | Overall Best Spring Angle |
|---|---|---|---|
| 26° South in Summer | 46° South in Autumn | 57° South in Winter | 35° South in Spring |
Our recommendations take into account more than just latitude and Earth's position in its elliptical orbit around the Sun. We also incorporate historical solar and meteorological data from NASA's Prediction of Worldwide Energy Resources (POWER) API to assign a weight to each ideal angle for each day based on its historical contribution to overall solar PV potential during a specific season.
This approach allows us to provide much more accurate recommendations than relying solely on latitude, as it considers unique weather conditions in different locations sharing the same latitude worldwide.
Calculate solar panel row spacing in Cincinnatus, United States
We've added a feature to calculate minimum solar panel row spacing by location. Enter your panel size and orientation below to get the minimum spacing in Cincinnatus, United States.
Our calculation method
- Solar Position:
We determine the Sun's position on the Winter solstice using the location's latitude and solar declination. - Shadow Projection:
We calculate the shadow length cast by panels using trigonometry, considering panel tilt and the Sun's elevation angle. - Minimum Spacing:
We add the shadow length to the horizontal space occupied by tilted panels.
This approach ensures maximum space efficiency while avoiding shading during critical times, as the Winter solstice represents the worst-case scenario for shadow length.
Topography for solar PV around Cincinnatus, United States
The area around Cincinnatus, located in central New York State, is characterized by a diverse and picturesque topography typical of the Appalachian Plateau region. The landscape is dominated by rolling hills, gentle valleys, and numerous small streams and creeks that wind their way through the countryside. The terrain is generally undulating, with elevations ranging from about 1,000 to 1,800 feet above sea level. Cincinnatus itself is situated in a valley formed by the Otselic River, which flows through the center of the town. The valley floor is relatively flat, providing a stark contrast to the surrounding hills that rise on either side. These hills are often steep-sided and covered in a mix of deciduous and coniferous forests, creating a patchwork of green hues that change dramatically with the seasons.
Nearby Areas Suitable for Large-Scale Solar PV
While the hilly terrain around Cincinnatus presents some challenges for large-scale solar photovoltaic (PV) installations, there are areas in the vicinity that could potentially be suitable for such projects. The most promising locations would likely be found in the broader, flatter areas of the valley floors, particularly to the north and south of Cincinnatus along the Otselic River valley. These areas offer more level ground, which is ideal for the installation of solar panels. The open farmland that exists in parts of the valley would provide the necessary space for large arrays without requiring extensive land clearing. Additionally, these locations often have good access to existing roads and power infrastructure, which are important factors for solar development. However, it's important to note that the region's climate, characterized by long, cold winters and relatively frequent cloud cover, may impact the overall efficiency of solar energy production. Careful site selection and thorough feasibility studies would be necessary to identify the most suitable locations for large-scale solar PV projects in this area. Any potential solar development would also need to consider environmental factors, such as impact on local ecosystems and wildlife, as well as zoning regulations and community concerns. The scenic nature of the landscape means that visual impact assessments would likely be an important part of any proposed solar project in the region.United States solar PV Stats as a country
United States ranks 2nd in the world for cumulative solar PV capacity, with 95,209 total MW's of solar PV installed. This means that 3.40% of United States's total energy as a country comes from solar PV (that's 26th in the world). Each year United States is generating 289 Watts from solar PV per capita (United States ranks 15th in the world for solar PV Watts generated per capita). [source]
Are there incentives for businesses to install solar in United States?
Yes, there are several incentives for businesses wanting to install solar energy in the United States. These include federal tax credits, state and local rebates, net metering policies, and renewable energy certificates (RECs). Additionally, many states have enacted legislation that requires utilities to purchase a certain amount of electricity from renewable sources such as solar.
Do you have more up to date information than this on incentives towards solar PV projects in United States? Please reach out to us and help us keep this information current. Thanks!
Citation Guide
Article Details for Citation
Author: Aaron Robinson
Publisher: profileSOLAR.com
First Published: Wednesday 13th of November 2024
Last Updated: Monday 21st of July 2025
Tell Us About Your Work
We love seeing how our research helps others! If you've cited this article in your work, we'd be delighted to hear about it. Drop us a line via our Contact Us page or on X, to share where you've used our information - we may feature a link to your work on our site. This helps create a network of valuable resources for others in the solar energy community and helps us understand how our research is contributing to the field. Plus, we occasionally highlight exceptional works that reference our research on our social media channels.
Feeling generous?

Share this with your friends!


Compare this location to others worldwide for solar PV potential
The solar PV analyses available on our website, including this one, are offered as a free service to the global community. Our aim is to provide education and aid informed decision-making regarding solar PV installations.
However, please note that these analyses are general guidance and may not meet specific project requirements. For in-depth, tailored forecasts and analysis crucial for feasibility studies or when pursuing maximum ROI from your solar projects, feel free to contact us; we offer comprehensive consulting services expressly for this purpose.

Helping you assess viability of solar PV for your site
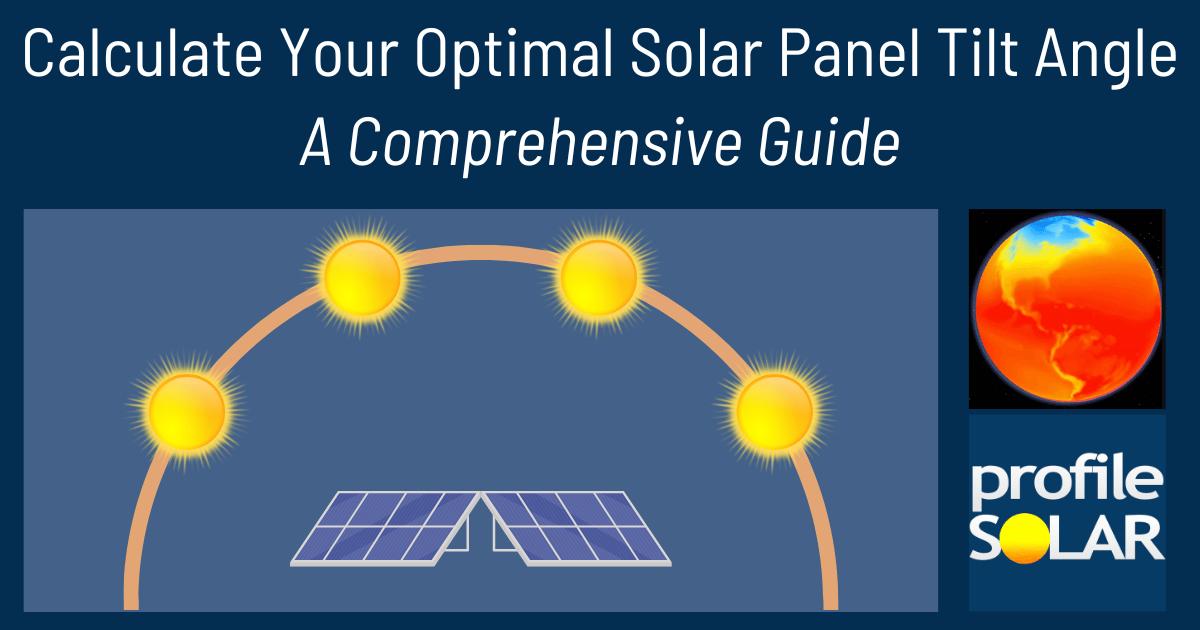
Calculate Your Optimal Solar Panel Tilt Angle: A Comprehensive Guide
Enhance your solar panel's performance with our in-depth guide. Determine the best tilt angle using hard data, debunk common misunderstandings, and gain insight into how your specific location affects solar energy production.