


 United StatesNew York
New York
kWh/day per 1 kWp · shared scale 0–10
- Tilt
- 35°
- Faces
- South
profileSOLAR Location estimates
How does solar output vary from place to place? Compare four seasonal average-day estimates on the same 1 kWp panel-capacity basis. No account or electricity file needed.
Explore by map
Move or zoom the interactive map to choose an area. The location list updates to show catalogue locations inside the current view.
Filter the visible list by place or country. Grouped markers combine nearby catalogue locations when needed; move closer to reveal individual places.
Open the interactive map and location list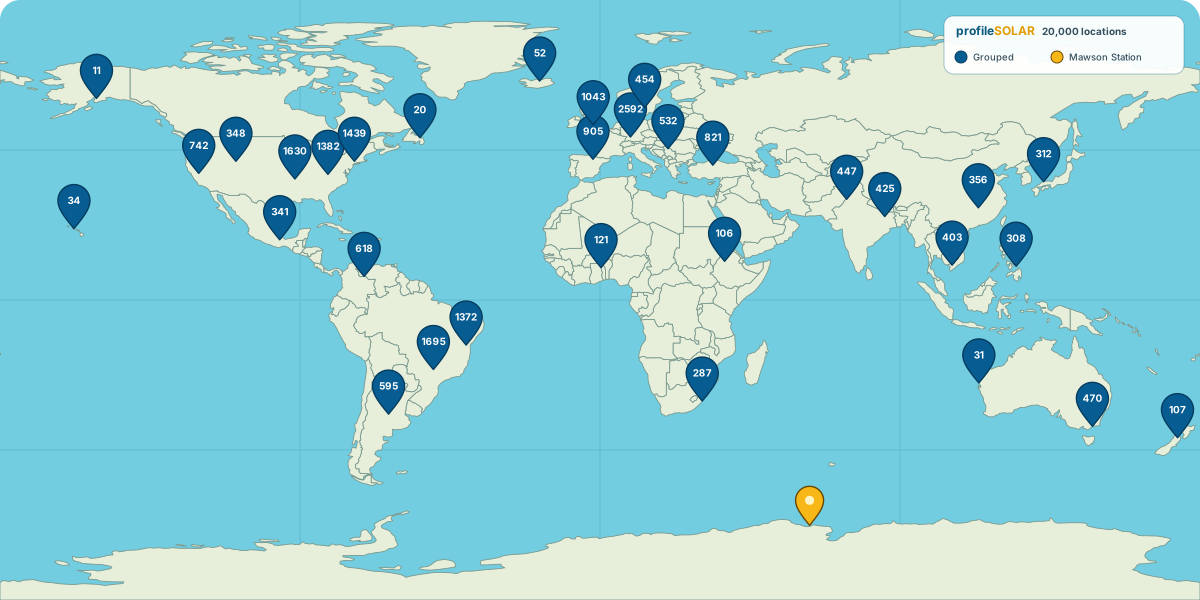
Browse by country
Choose a starting country for nearby and related browsing suggestions.
Starting country: United States. You can change it here.
Available land-border neighbours are shown first. These are browsing suggestions, not a ranking. Further examples are not a researched relationship list.
Land neighbours and island proximity use country geography, not distances between catalogue cities. Countries and territories keep their catalogue labels; nearby does not mean a shared land border. Selected regional and trade connections are separately researched where shown. Worldwide examples are not an affinity list.
This choice changes only this section and is kept in the page address—not in browser storage. Geography and selected relationships reviewed 12 October 2026; not a ranking or an assumption about your interests.
Location preview
Compare four seasonal average-day estimates on the same scale, with the recorded panel tilt and facing direction.
Twelve recognisable cities across six continents, one per country, chosen for geographic variety alongside countries with substantial solar adoption. This editorial selection is not a performance ranking or a scientifically representative sample.
United StatesNew York
kWh/day per 1 kWp · shared scale 0–10
 BrazilRio de Janeiro
kWh/day per 1 kWp · shared scale 0–10
 GermanyLand Berlin
kWh/day per 1 kWp · shared scale 0–10
 South AfricaWestern Cape
kWh/day per 1 kWp · shared scale 0–10
kWh/day per 1 kWp · shared scale 0–10
 AustraliaNew South Wales
kWh/day per 1 kWp · shared scale 0–10
 ChinaBeijing
kWh/day per 1 kWp · shared scale 0–10
kWh/day per 1 kWp · shared scale 0–10
 JapanTokyo
kWh/day per 1 kWp · shared scale 0–10
 SpainMadrid
kWh/day per 1 kWp · shared scale 0–10
 EgyptCairo Governorate
kWh/day per 1 kWp · shared scale 0–10
 SwedenStockholm County
kWh/day per 1 kWp · shared scale 0–10
How estimates work
These precomputed Location estimates use profileSOLAR's original solar-resource calibration method. They describe seasonal average days, not a prediction for your roof.
The preserved records attribute the source inputs to NASA POWER’s Hourly data service. Browsing the catalogue makes no live NASA request.
Read the source history, units and limits before using a figure for planning.
Read how estimates workFrom comparison to planning
Compare places here, or learn about Detailed site analysis at profile.solar. Account access and permission to run new calculations are separate.
Public catalogue
Explore seasonal Location estimates at profilesolar.com, with simple capacity and row-spacing illustrations. No account or upload needed.
Choose a location for these toolsprofile.solar
Whether you’re exploring solar for your own project or comparing options for your clients, profileSOLAR helps you assess historical generation, compare system configurations and produce clear reports. Modelled results are not a production guarantee.
Detailed analysis for your project or your clients.
Explore features and paid access in the app, or use the complimentary testing access included in your invitation.
Explore Detailed site analysisPlanned · not available in this release
Electricity/interval-data and battery tools remain in development. They are not available to release users; the initial app release focuses on projects, Detailed Analysis and existing PDF options.
Explore the profileSOLAR appQuestions and feedback
Ask about the public Location estimates or the separate Detailed site analysis product.