Solar PV Analysis of East Falmouth, United States
East Falmouth, Massachusetts, located in the Northern Temperate Zone, presents a moderately favorable location for year-round solar PV energy generation, though with significant seasonal variations that potential solar installers should carefully consider.
Seasonal Solar Performance
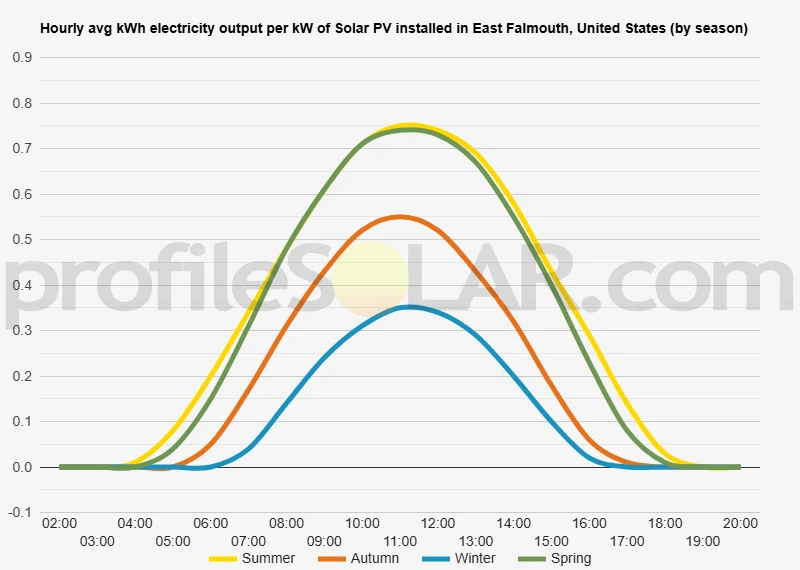
The solar energy production at this location varies dramatically throughout the year. Summer delivers the strongest performance at 6.08 kWh per day per kW of installed solar capacity, making it the peak season for solar generation. Spring follows as the second-best season with 5.72 kWh per day per kW, offering nearly comparable output to summer months. Autumn sees a notable decline to 3.57 kWh per day per kW, while winter presents the most challenging conditions with only 2.04 kWh per day per kW. This winter output represents just one-third of the summer production, highlighting the seasonal dependency of solar generation at this latitude.Optimal Installation Configuration
For maximum year-round solar production at East Falmouth, fixed solar panels should be tilted at 36 degrees facing south. This angle has been calculated to optimize total annual energy output by accounting for the sun's varying position throughout the year and weighting for daily solar potential based on NASA solar irradiance data.Local Environmental and Weather Challenges
Several significant local factors can impede solar production in East Falmouth and require careful consideration during installation:- Coastal salt air and corrosion: Being located near Cape Cod's coastline, solar installations face constant exposure to salt-laden air that can corrode mounting hardware, electrical connections, and panel frames over time
- Winter snow accumulation: New England winters can deposit substantial snow loads on solar panels, completely blocking energy production until cleared
- Coastal storms and high winds: The location's proximity to the Atlantic Ocean increases exposure to nor'easters, hurricanes, and severe coastal storms with damaging winds
- Marine layer and fog: Coastal fog and marine layers can reduce solar irradiance, particularly during certain seasons and weather patterns
Preventative Installation Measures
To maximize energy production despite these challenges, several installation strategies should be implemented:- Corrosion-resistant materials: Use marine-grade aluminum mounting systems, stainless steel hardware, and panels with reinforced frames designed for coastal environments
- Enhanced structural support: Install mounting systems rated for higher wind loads and potential ice accumulation, following local building codes for coastal wind zones
- Snow management design: Position panels at the optimal 36-degree tilt to promote natural snow shedding, and ensure adequate spacing between panel rows to prevent snow buildup
- Regular maintenance scheduling: Implement more frequent cleaning and inspection schedules to address salt buildup and storm damage
- Electrical protection: Use enhanced weatherproofing for all electrical connections and consider marine-grade conduits and junction boxes
Note: The Northern Temperate Zone extends from 35° latitude North up to 66.5° latitude.
So far, we have conducted calculations to evaluate the solar photovoltaic (PV) potential in 4253 locations across the United States. This analysis provides insights into each city/location's potential for harnessing solar energy through PV installations.
Link: Solar PV potential in the United States by location
Solar output per kW of installed solar PV by season in East Falmouth
Seasonal solar PV output for Latitude: 41.5784, Longitude: -70.5586 (East Falmouth, United States), based on our analysis of 8760 hourly intervals of solar and meteorological data (one whole year) retrieved for that set of coordinates/location from NASA POWER (The Prediction of Worldwide Energy Resources) API:




Ideally tilt fixed solar panels 36° South in East Falmouth, United States
To maximize your solar PV system's energy output in East Falmouth, United States (Lat/Long 41.5784, -70.5586) throughout the year, you should tilt your panels at an angle of 36° South for fixed panel installations.
As the Earth revolves around the Sun each year, the maximum angle of elevation of the Sun varies by +/- 23.45 degrees from its equinox elevation angle for a particular latitude. Finding the exact optimal angle to maximise solar PV production throughout the year can be challenging, but with careful consideration of historical solar energy and meteorological data for a certain location, it can be done precisely.
We use our own calculation, which incorporates NASA solar and meteorological data for the exact Lat/Long coordinates, to determine the ideal tilt angle of a solar panel that will yield maximum annual solar output. We calculate the optimal angle for each day of the year, taking into account its contribution to the yearly total PV potential at that specific location.

Seasonally adjusted solar panel tilt angles for East Falmouth, United States
If you can adjust the tilt angle of your solar PV panels, please refer to the seasonal tilt angles below for optimal solar energy production in East Falmouth, United States. As mentioned earlier, for fixed-panel solar PV installations, it is optimal to maintain a 36° South tilt angle throughout the year.
| Overall Best Summer Angle | Overall Best Autumn Angle | Overall Best Winter Angle | Overall Best Spring Angle |
|---|---|---|---|
| 25° South in Summer | 46° South in Autumn | 56° South in Winter | 34° South in Spring |
Our recommendations take into account more than just latitude and Earth's position in its elliptical orbit around the Sun. We also incorporate historical solar and meteorological data from NASA's Prediction of Worldwide Energy Resources (POWER) API to assign a weight to each ideal angle for each day based on its historical contribution to overall solar PV potential during a specific season.
This approach allows us to provide much more accurate recommendations than relying solely on latitude, as it considers unique weather conditions in different locations sharing the same latitude worldwide.
Calculate solar panel row spacing in East Falmouth, United States
We've added a feature to calculate minimum solar panel row spacing by location. Enter your panel size and orientation below to get the minimum spacing in East Falmouth, United States.
Our calculation method
- Solar Position:
We determine the Sun's position on the Winter solstice using the location's latitude and solar declination. - Shadow Projection:
We calculate the shadow length cast by panels using trigonometry, considering panel tilt and the Sun's elevation angle. - Minimum Spacing:
We add the shadow length to the horizontal space occupied by tilted panels.
This approach ensures maximum space efficiency while avoiding shading during critical times, as the Winter solstice represents the worst-case scenario for shadow length.
Topography for solar PV around East Falmouth, United States
Topographical Features of East Falmouth
East Falmouth sits on the southwestern portion of Cape Cod in Massachusetts, characterized by gently rolling terrain typical of glacially formed landscapes. The area features relatively low elevation changes, with most of the region lying between sea level and approximately 150 feet above sea level. The topography consists of modest hills, shallow valleys, and numerous kettle ponds created by retreating glaciers during the last ice age. The landscape around East Falmouth is dominated by sandy soils and well-drained terrain, with occasional wetland areas and cranberry bogs scattered throughout the region. The coastal proximity means the land gradually slopes toward Buzzards Bay to the west and Vineyard Sound to the south, creating natural drainage patterns that flow toward these water bodies.Vegetation and Land Use Patterns
The area supports a mix of pitch pine and oak forests, typical of Cape Cod's scrubland ecosystem. Much of the surrounding landscape consists of residential developments interspersed with preserved conservation lands and recreational areas. Agricultural use is limited, though some cranberry cultivation occurs in suitable bog areas. The relatively sparse tree cover in many areas, combined with the sandy soil composition, creates favorable conditions for ground-mounted installations.Optimal Areas for Large-Scale Solar Development
The most suitable locations for large-scale solar photovoltaic installations around East Falmouth would be the gently sloping upland areas with southern or southwestern exposures. These elevated areas, typically found inland from the immediate coastal zone, offer several advantages including reduced salt air exposure, stable ground conditions, and minimal shading from surrounding vegetation. Former agricultural fields and cleared areas in the northern and western portions of the broader Falmouth area present excellent opportunities for solar development. These locations benefit from existing cleared land, established road access, and proximity to electrical infrastructure. The relatively flat to gently rolling terrain minimizes grading requirements and allows for efficient panel arrangement. Areas near the Otis Air National Guard Base and surrounding military lands offer potential for large installations due to the extensive cleared areas and existing infrastructure. The base's elevated position and open terrain create ideal conditions for solar arrays, though development would require coordination with military operations and security requirements.Environmental and Practical Considerations
The Cape Cod region's regulatory environment emphasizes environmental protection, particularly regarding groundwater resources and sensitive ecological areas. Developers must navigate local zoning requirements and environmental review processes, especially when projects are proposed near wetlands, rare species habitats, or drinking water supply areas. The sandy soil conditions, while generally stable, may require specialized foundation systems for large installations. However, this soil type also provides excellent drainage, reducing concerns about standing water or frost heave that might affect panel mounting systems. The relatively low relief of the terrain means that most suitable sites would not require extensive earthwork or create significant visual impacts when properly screened with native vegetation. Wind exposure from coastal storms represents a design consideration for any large-scale installation in the area, requiring robust mounting systems capable of withstanding periodic high wind events. The open nature of much of the terrain means that installations must be designed to handle consistent wind loads throughout the operational life of the system.United States solar PV Stats as a country
United States ranks 2nd in the world for cumulative solar PV capacity, with 95,209 total MW's of solar PV installed. This means that 3.40% of United States's total energy as a country comes from solar PV (that's 26th in the world). Each year United States is generating 289 Watts from solar PV per capita (United States ranks 15th in the world for solar PV Watts generated per capita). [source]
Are there incentives for businesses to install solar in United States?
Yes, there are several incentives for businesses wanting to install solar energy in the United States. These include federal tax credits, state and local rebates, net metering policies, and renewable energy certificates (RECs). Additionally, many states have enacted legislation that requires utilities to purchase a certain amount of electricity from renewable sources such as solar.
Do you have more up to date information than this on incentives towards solar PV projects in United States? Please reach out to us and help us keep this information current. Thanks!
Citation Guide
Article Details for Citation
Author: Aaron Robinson
Publisher: profileSOLAR.com
First Published: Thursday 31st of July 2025
Last Updated: Friday 8th of August 2025
Tell Us About Your Work
We love seeing how our research helps others! If you've cited this article in your work, we'd be delighted to hear about it. Drop us a line via our Contact Us page or on X, to share where you've used our information - we may feature a link to your work on our site. This helps create a network of valuable resources for others in the solar energy community and helps us understand how our research is contributing to the field. Plus, we occasionally highlight exceptional works that reference our research on our social media channels.
Feeling generous?

Share this with your friends!


Compare this location to others worldwide for solar PV potential
The solar PV analyses available on our website, including this one, are offered as a free service to the global community. Our aim is to provide education and aid informed decision-making regarding solar PV installations.
However, please note that these analyses are general guidance and may not meet specific project requirements. For in-depth, tailored forecasts and analysis crucial for feasibility studies or when pursuing maximum ROI from your solar projects, feel free to contact us; we offer comprehensive consulting services expressly for this purpose.

Helping you assess viability of solar PV for your site
Calculate Your Optimal Solar Panel Tilt Angle: A Comprehensive Guide
Enhance your solar panel's performance with our in-depth guide. Determine the best tilt angle using hard data, debunk common misunderstandings, and gain insight into how your specific location affects solar energy production.