Solar PV Analysis of Greenfield, Wisconsin, United States
Greenfield, Wisconsin, United States, located at latitude 42.957 and longitude -87.9898 in the Northern Temperate Zone, offers varying solar PV energy generation potential throughout the year. This location experiences significant seasonal fluctuations in solar electricity production that are important to consider when planning a solar installation.
Seasonal Solar Production
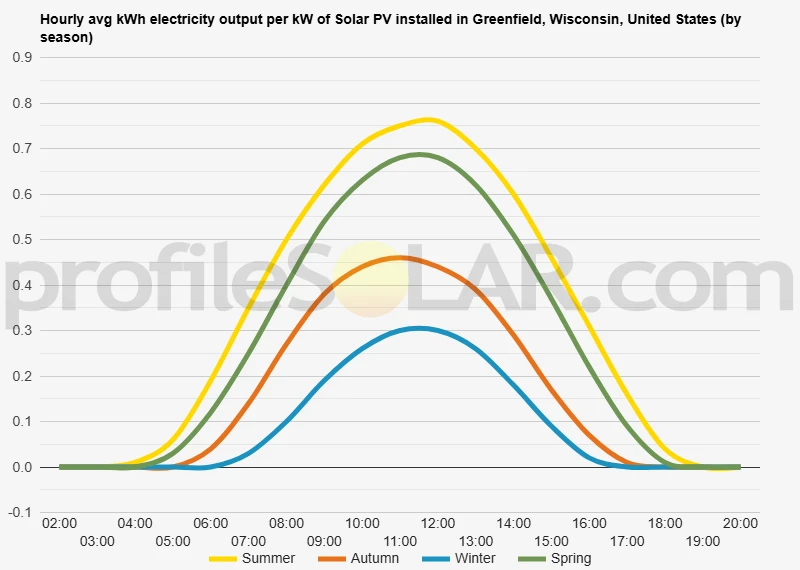
Solar panels in Greenfield demonstrate strong performance during summer months, generating approximately 6.21 kWh per day for each kilowatt of installed capacity. Spring follows as the second most productive season with 5.15 kWh/day per installed kilowatt. However, production decreases substantially during autumn to 3.11 kWh/day and reaches its lowest point in winter with just 1.74 kWh/day per kilowatt of installed capacity.
This seasonal pattern creates a roughly 3.5-fold difference between the best and worst production months, with summer generating more than three times the electricity of winter months. This variation is typical for locations in the Northern Temperate Zone but represents a significant consideration for system sizing and expectations.
Optimal Installation Angle
For a fixed panel installation in Greenfield, the ideal tilt angle to maximize year-round solar production is 37 degrees facing South. This angle optimizes the overall annual energy harvest by balancing seasonal variations and the sun's changing position throughout the year.
Environmental and Weather Considerations
Several local factors in Greenfield could potentially impact solar production:
- Winter snow accumulation can significantly reduce energy production if panels become covered, requiring either manual clearing or steep installation angles to promote natural snow shedding
- The region experiences frequent cloud cover, particularly during late autumn and winter months, which coincides with already reduced solar angles
- Nearby deciduous trees may cast shadows during certain times of year, with leaf-off periods in winter providing some mitigation
To maximize production despite these challenges, installations should include preventative measures like adequate panel elevation to reduce snow accumulation impacts, microinverters or power optimizers to minimize the effects of partial shading, and thorough site assessment to avoid placement where buildings or evergreen trees might cast shadows during peak production hours.
Overall, Greenfield provides good solar potential despite its seasonal variations, with summer and spring offering excellent production opportunities that can offset the reduced winter performance when the system is properly designed and installed.
Note: The Northern Temperate Zone extends from 35° latitude North up to 66.5° latitude.
So far, we have conducted calculations to evaluate the solar photovoltaic (PV) potential in 4253 locations across the United States. This analysis provides insights into each city/location's potential for harnessing solar energy through PV installations.
Link: Solar PV potential in the United States by location
Solar output per kW of installed solar PV by season in Greenfield, Wisconsin
Seasonal solar PV output for Latitude: 42.957, Longitude: -87.9898 (Greenfield, Wisconsin, United States), based on our analysis of 8760 hourly intervals of solar and meteorological data (one whole year) retrieved for that set of coordinates/location from NASA POWER (The Prediction of Worldwide Energy Resources) API:




Ideally tilt fixed solar panels 37° South in Greenfield, Wisconsin, United States
To maximize your solar PV system's energy output in Greenfield, Wisconsin, United States (Lat/Long 42.957, -87.9898) throughout the year, you should tilt your panels at an angle of 37° South for fixed panel installations.
As the Earth revolves around the Sun each year, the maximum angle of elevation of the Sun varies by +/- 23.45 degrees from its equinox elevation angle for a particular latitude. Finding the exact optimal angle to maximise solar PV production throughout the year can be challenging, but with careful consideration of historical solar energy and meteorological data for a certain location, it can be done precisely.
We use our own calculation, which incorporates NASA solar and meteorological data for the exact Lat/Long coordinates, to determine the ideal tilt angle of a solar panel that will yield maximum annual solar output. We calculate the optimal angle for each day of the year, taking into account its contribution to the yearly total PV potential at that specific location.

Seasonally adjusted solar panel tilt angles for Greenfield, Wisconsin, United States
If you can adjust the tilt angle of your solar PV panels, please refer to the seasonal tilt angles below for optimal solar energy production in Greenfield, Wisconsin, United States. As mentioned earlier, for fixed-panel solar PV installations, it is optimal to maintain a 37° South tilt angle throughout the year.
| Overall Best Summer Angle | Overall Best Autumn Angle | Overall Best Winter Angle | Overall Best Spring Angle |
|---|---|---|---|
| 27° South in Summer | 47° South in Autumn | 57° South in Winter | 36° South in Spring |
Our recommendations take into account more than just latitude and Earth's position in its elliptical orbit around the Sun. We also incorporate historical solar and meteorological data from NASA's Prediction of Worldwide Energy Resources (POWER) API to assign a weight to each ideal angle for each day based on its historical contribution to overall solar PV potential during a specific season.
This approach allows us to provide much more accurate recommendations than relying solely on latitude, as it considers unique weather conditions in different locations sharing the same latitude worldwide.
Calculate solar panel row spacing in Greenfield, Wisconsin, United States
We've added a feature to calculate minimum solar panel row spacing by location. Enter your panel size and orientation below to get the minimum spacing in Greenfield, Wisconsin, United States.
Our calculation method
- Solar Position:
We determine the Sun's position on the Winter solstice using the location's latitude and solar declination. - Shadow Projection:
We calculate the shadow length cast by panels using trigonometry, considering panel tilt and the Sun's elevation angle. - Minimum Spacing:
We add the shadow length to the horizontal space occupied by tilted panels.
This approach ensures maximum space efficiency while avoiding shading during critical times, as the Winter solstice represents the worst-case scenario for shadow length.
Topography for solar PV around Greenfield, Wisconsin, United States
Topography of Greenfield, Wisconsin
Greenfield, located in Milwaukee County, Wisconsin, features a relatively flat to gently rolling topography characteristic of the western Great Lakes region. The area sits on what geologists call the Eastern Ridges and Lowlands geographic province of Wisconsin, which was shaped primarily by glacial activity during the last ice age. The elevation in Greenfield averages around 730-790 feet above sea level, with minimal dramatic changes in elevation throughout the city. The landscape around Greenfield consists primarily of glacial till plains with scattered moraines and drumlins—small, elongated hills formed by glacial ice movement. These subtle undulations create a quietly varied terrain rather than dramatic relief. The Root River, a tributary of Lake Michigan, passes through portions of the greater area, creating shallow valleys and natural drainage pathways. The region's topography was heavily influenced by the Wisconsin Glaciation period, which ended approximately 10,000 years ago, leaving behind the current landform features. This glacial history contributed to the creation of fertile soils and the relatively level terrain that characterizes much of southeastern Wisconsin.Solar PV Suitability in the Region
When considering large-scale solar photovoltaic (PV) installation in the Greenfield vicinity, several nearby areas present favorable conditions based on topographical factors. The most suitable locations would include: The open, gently sloping agricultural lands that surround Greenfield to the southwest offer ideal conditions for solar PV deployment. These areas benefit from minimal shading obstacles and land that requires little grading before installation. The slight southern-facing slopes that occasionally occur in this region would be particularly advantageous for maximizing solar collection throughout the year. Former industrial or commercial properties within the greater Milwaukee metropolitan area could also be repurposed for solar installations. These brownfield sites often feature large, flat expanses with existing infrastructure connections, making them cost-effective for development. Many of these properties lie along the industrial corridors that extend from Milwaukee through the surrounding suburbs. The rural-urban transition zones south of Greenfield, particularly in northern Racine County, combine favorable topography with proximity to existing electrical infrastructure. These areas typically have fewer land use conflicts than densely populated urban centers while maintaining connection to the power grid. It's worth noting that while the topography around Greenfield is generally conducive to solar development, other factors such as local zoning regulations, grid connection capacity, and land availability will significantly influence specific site selection. The region's four distinct seasons also mean that winter snow accumulation must be considered in the design and placement of solar arrays, though the relatively flat terrain simplifies snow management compared to more varied landscapes.United States solar PV Stats as a country
United States ranks 2nd in the world for cumulative solar PV capacity, with 95,209 total MW's of solar PV installed. This means that 3.40% of United States's total energy as a country comes from solar PV (that's 26th in the world). Each year United States is generating 289 Watts from solar PV per capita (United States ranks 15th in the world for solar PV Watts generated per capita). [source]
Are there incentives for businesses to install solar in United States?
Yes, there are several incentives for businesses wanting to install solar energy in the United States. These include federal tax credits, state and local rebates, net metering policies, and renewable energy certificates (RECs). Additionally, many states have enacted legislation that requires utilities to purchase a certain amount of electricity from renewable sources such as solar.
Do you have more up to date information than this on incentives towards solar PV projects in United States? Please reach out to us and help us keep this information current. Thanks!
Citation Guide
Article Details for Citation
Author: Aaron Robinson
Publisher: profileSOLAR.com
First Published: Wednesday 23rd of April 2025
Last Updated: Monday 21st of July 2025
Tell Us About Your Work
We love seeing how our research helps others! If you've cited this article in your work, we'd be delighted to hear about it. Drop us a line via our Contact Us page or on X, to share where you've used our information - we may feature a link to your work on our site. This helps create a network of valuable resources for others in the solar energy community and helps us understand how our research is contributing to the field. Plus, we occasionally highlight exceptional works that reference our research on our social media channels.
Feeling generous?

Share this with your friends!


Compare this location to others worldwide for solar PV potential
The solar PV analyses available on our website, including this one, are offered as a free service to the global community. Our aim is to provide education and aid informed decision-making regarding solar PV installations.
However, please note that these analyses are general guidance and may not meet specific project requirements. For in-depth, tailored forecasts and analysis crucial for feasibility studies or when pursuing maximum ROI from your solar projects, feel free to contact us; we offer comprehensive consulting services expressly for this purpose.

Helping you assess viability of solar PV for your site
Calculate Your Optimal Solar Panel Tilt Angle: A Comprehensive Guide
Enhance your solar panel's performance with our in-depth guide. Determine the best tilt angle using hard data, debunk common misunderstandings, and gain insight into how your specific location affects solar energy production.