 IsraelNorthern District
'En Dor
32.6529, 35.4196
kWh/day per 1 kWp · shared scale 0–10
- Tilt
- 28°
- Faces
- South
Current list: 20,000 locations. Current catalogue list · 20,000 locations
profileSOLAR Location estimates
Search 20,000 locations across 214 countries. Google Maps is optional.
Browse countries20,000 matching locations across the catalogue · Google Maps off.
Skip map to locations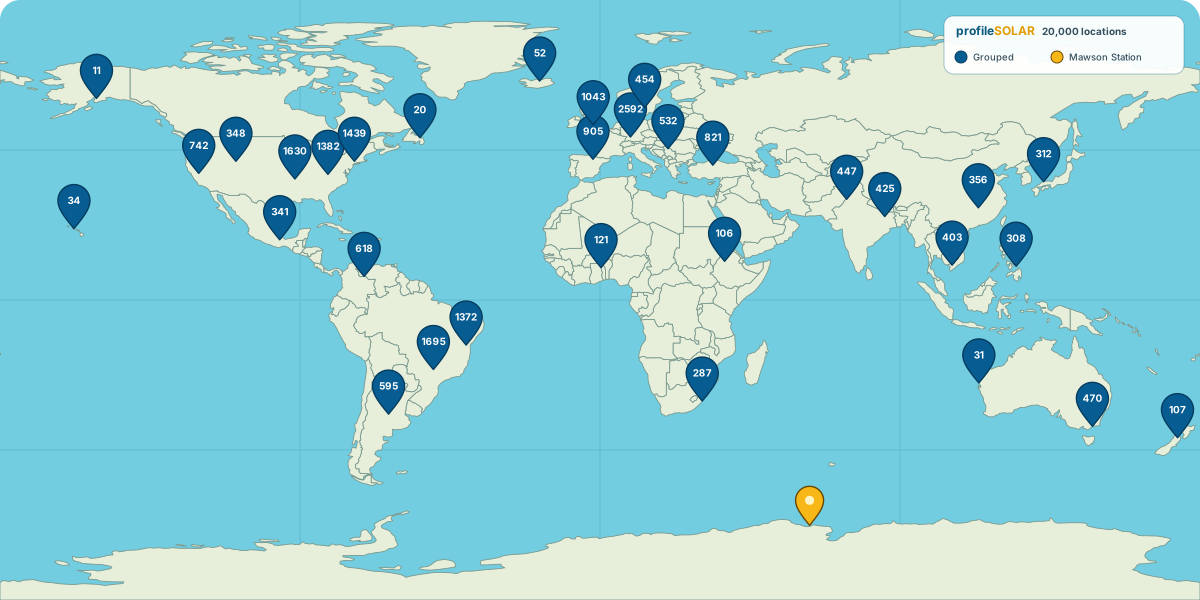
The profileSOLAR catalogue—not Google Places—supplies every area and location shown.
The retained records attribute these estimates to NASA POWER’s Hourly data service. Browsing makes no live NASA request.
Google's Maps terms and Privacy Policy apply. profileSOLAR stores only your map choice and its expiry in this browser for up to 180 days. It is not linked to an IP address or a server-side identifier. Read the profileSOLAR privacy notice.
You can change the remembered choice beside the map at any time. Withdrawing it prevents future automatic loads but cannot undo requests already sent to Google on the current page.
Before you load the map, this page requests no Google map configuration, scripts, tiles or telemetry.
Interactive map not loaded. The location catalogue remains available below.
Move or zoom the map to update its markers and the visible-location catalogue. Open a grouped marker to move closer.
Changing the search or country fits the matching locations once. Panning and page navigation keep your view. Reset keeps your filters and returns to the overview; Clear removes the filters and fits the full catalogue.
Hover or focus a grouped marker to outline its catalogue grouping area. Individual pins do not draw a box. Grouping areas are not political borders.
Location list
Summer and winter estimates stay separate so seasonal differences remain clear.
A kilowatt-hour (kWh) measures electrical energy. Each card shows estimated average daily energy for every 1 kWp of rated panel capacity.
20,000 matching locations across the complete catalogue · Page 1 of 834. The map does not limit this list unless you load it.
IsraelNorthern District32.6529, 35.4196
kWh/day per 1 kWp · shared scale 0–10
 United StatesHawaii
21.3267, -158.008
kWh/day per 1 kWp · shared scale 0–10
IsraelSouthern District31.264, 34.854
kWh/day per 1 kWp · shared scale 0–10
 NetherlandsSouth Holland
51.9976, 4.1591
kWh/day per 1 kWp · shared scale 0–10
NetherlandsNorth Brabant51.6906, 5.2755
kWh/day per 1 kWp · shared scale 0–10
 CanadaBritish Columbia
51.6491, -121.2838
kWh/day per 1 kWp · shared scale 0–10
 EgyptGiza
29.9436, 30.9171
kWh/day per 1 kWp · shared scale 0–10
 SpainGalicia
43.3476, -8.4126
kWh/day per 1 kWp · shared scale 0–10
SpainGalicia42.7202, -8.4338
kWh/day per 1 kWp · shared scale 0–10
 LebanonNorth Lebanon
34.2735, 35.887
kWh/day per 1 kWp · shared scale 0–10
 DenmarkSouth Denmark
55.033, 9.4398
kWh/day per 1 kWp · shared scale 0–10
 GermanyNorth Rhine-Westphalia
50.7745, 6.0861
kWh/day per 1 kWp · shared scale 0–10
57.0488, 9.9217
kWh/day per 1 kWp · shared scale 0–10
GermanyBaden-Wurttemberg48.8187, 10.0691
kWh/day per 1 kWp · shared scale 0–10
NetherlandsNorth Holland52.2751, 4.7914
kWh/day per 1 kWp · shared scale 0–10
 BelgiumFlanders
50.9341, 4.0392
kWh/day per 1 kWp · shared scale 0–10
 SwitzerlandAargau
47.3906, 8.0373
kWh/day per 1 kWp · shared scale 0–10
56.1629, 10.2039
kWh/day per 1 kWp · shared scale 0–10
 NigeriaAbia State
5.1069, 7.3748
kWh/day per 1 kWp · shared scale 0–10
 Saudi ArabiaNajran Region
17.4705, 44.1014
kWh/day per 1 kWp · shared scale 0–10
 BrazilGoiás
-16.7764, -49.4646
kWh/day per 1 kWp · shared scale 0–10
 AlgeriaBéchar
30.9058, -2.305
kWh/day per 1 kWp · shared scale 0–10
BrazilPará-1.7357, -48.9429
kWh/day per 1 kWp · shared scale 0–10
BrazilMinas Gerais-19.111, -45.4305
kWh/day per 1 kWp · shared scale 0–10
How to use the catalogue
These modelled, location-level estimates support broad seasonal comparisons. They are not a property survey, system design or production guarantee.
Grouped map markers show how many locations share a screen area. They do not indicate better solar potential or provide a site recommendation.